Category: Forecasting

  • “Irregular” Orders Aren’t Random

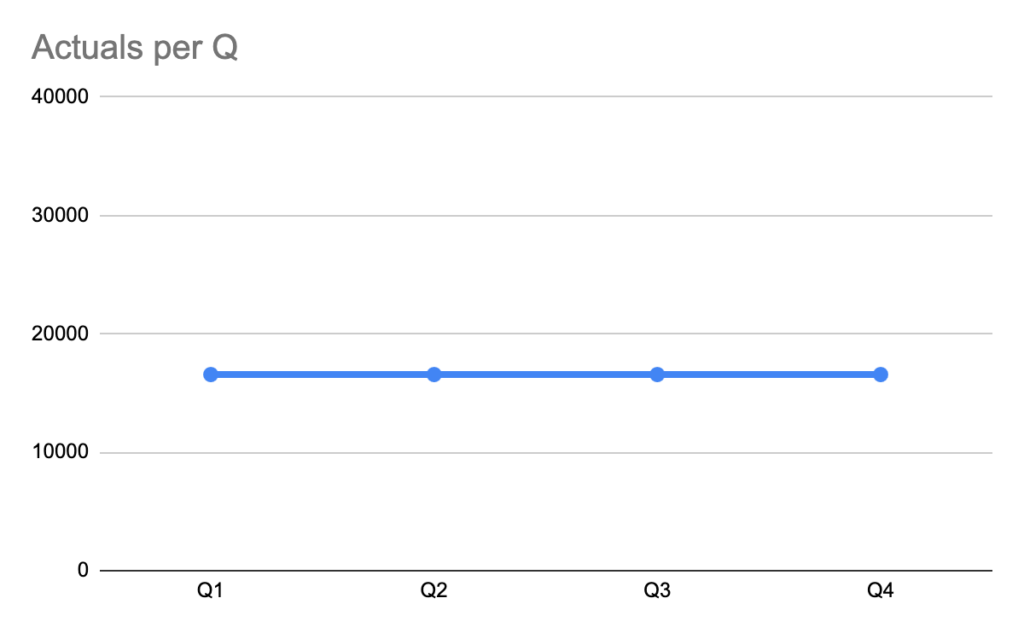
    Order pattern looks irregular—so irregular that your first reaction is:

    “This is intermittent demand; forecasting will be messy.”

    And yes, sometimes it is.

    But in many cases, it’s not “absolutely irregular.” There are patterns. The problem is that we often look for the wrong ones.

    Let me walk through a case I’ve seen more than once—and why a standard forecasting approach can produce horrible accuracy, even when the demand is actually quite structured.


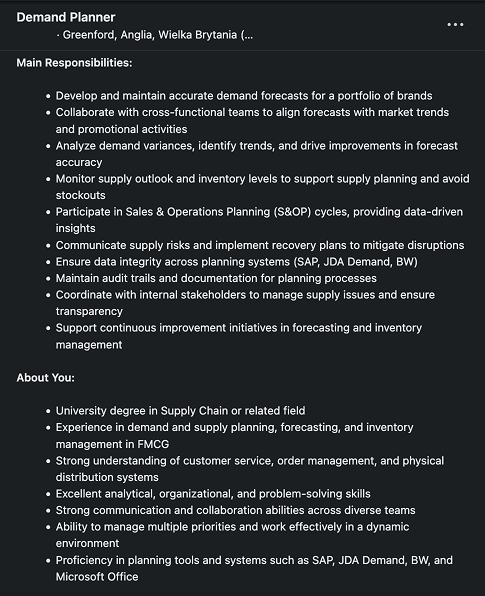
    Pattern #1: Irregular timing, but a stable weekly “envelope”

    At first glance, the orders arrive at inconsistent intervals. One week you get a hit, next week nothing, then two dips close to each other.

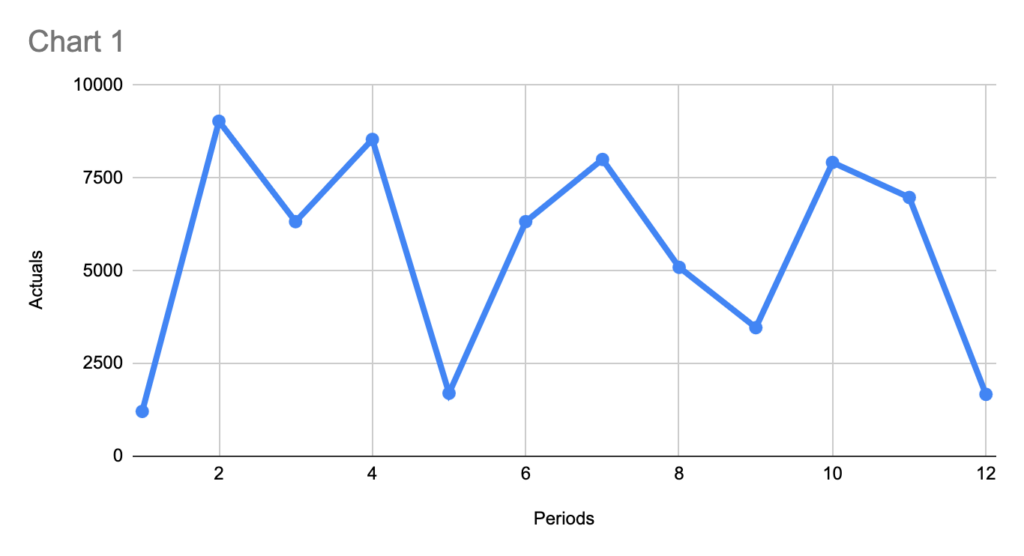
    Still, when you zoom out, you often see an estimated volume of demand per quarter that is stable. Look at same data on Quarterly granularity:

    In other words:

    Order timing is irregular
    But average quarterly throughput is not crazy

    Pattern – straight-forward. But only if you zoom out.


    Pattern #2: Volumes repeat — because quantities are discrete (not continuous)

    Some SKUs are ordered only in a specific base quantity (a “base unit”), always.

    If the customer makes an order, it is always:

    exactly the Base Unit, or
    a clean multiple of it

    Example :

    In such a case, making statistics on “number of kg” as if it were a smooth continuous variable often makes no sense. The demand is quantized.

    So even if your weekly forecast is “close” in an average sense, it can still be operationally wrong because it predicts values that cannot happen in reality (e.g., 1433 kg when the only feasible outcomes are 792 or 1584 kg).

    This is a classic planning trap:

    Forecast looks mathematically reasonable
    But it violates the ordering grammar of that SKU/customer combination
    Result: big errors, low trust, bad downstream decisions (inventory, production, transport planning)

    Why does this happen?

    Because the demand you observe is not purely consumption-driven—it’s consumption filtered through ordering constraints, such as:

    pack size / layer / pallet multiples
    minimum order quantities (MOQ)
    full-truck or delivery-slot economics
    internal customer ordering habits (“we always order 2 pallets”)
    system constraints (ERP rounding, UoM conversions)

    The “real” consumption may be smoother, but your order history is a rounded and batched signal.
    Can SAP IBP help? Yes, in concept—sometimes not in practice

    A potential solution direction is using Time Series Properties in SAP IBP (feature engineering for time series):

    In general, the concept is great: it encourages you to explicitly describe characteristics of the series and derive smarter features.

    But here’s my observation from the field:
    The limitation: it may not catch “base-unit multiple” demand

    These discrete-multiple patterns are not just seasonality, trend, or noise. They’re more like a rule-based quantization of order quantities.

    If the feature framework doesn’t explicitly detect and represent “order quantities come in multiples of X,” then:

    the model can still average across outcomes
    and it will keep producing “in-between” numbers that never occur

    Practical way to think about it (what usually works better)

    If I had to summarize the right mental model:
    Don’t forecast “kg” first. Forecast the ordering mechanism.

    A robust approach is usually two-layer:

    When will an order occur? (order event / probability)
    If an order occurs, how many base units will it be? (1x, 2x, 3x…)

    Then convert back to kg if needed.

    Even without building a complex ML stack, you can often improve results by introducing a simple constraint/post-processing step:

    detect the base unit from history (e.g., most common divisor or most frequent quantity step)
    forecast demand level
    then snap/round the forecast to the nearest feasible multiple (with sensible business rules)

    This alone can drastically reduce “nonsense forecasts” and improve planner trust—even if your underlying model doesn’t change.


    Final thought

    “Irregular orders” is often a misleading label. Many series are irregular in timing, but highly regular in allowed quantities. If you ignore that discreteness, you can spend months tuning models and still get terrible accuracy—because the model is solving the wrong problem.

  • Why the Moving Feast is a Companies’s Greatest Nightmare (and how to change it)

    Navigating the Most Volatile Window in the FMCG Calendar

    Easter is arguably the most complex period for any Forecasting or Demand Planning team. In my >5 years of international FMCG experience, I’ve seen even the most sophisticated systems stumble during this “moving feast.” To manage it successfully, you need more than just data—you need a deep understanding of the “Pattern” and the logistical friction that occurs behind the scenes.

    The “Moving Target” Problem: Why Algorithms Struggle

    The primary challenge of Easter is its timing. The earliest possible date is March 22nd (Week 12), and the latest is April 25th (Week 17). This five-week variance means that seasonal patterns cannot simply be “copied and pasted” from the previous year.

    While a human planner looks at the calendar and thinks,

    Ah, spring is here—Easter is coming,

    a standard Machine Learning algorithm often fails to make that connection unless it is fed specific Independent Variables. Without a “Holiday” indicator or a system linked directly to global calendars, AI cannot proactively find these dates without human intervention. To get a reliable forecast, your Advanced Planning System (APS) must be “taught” that these weeks are outliers.

    The Cluster Complication: Navigating Regional Rules

    Planning becomes significantly “messier” when you manage a cluster of countries rather than a single market. Take Iberia, for example:

    • Spain: Thursday and Friday before Easter, and Easter Monday are off*
    • Portugal: Friday before Easter is off.

    *depending on the region

    When estimating the impact, you must reflect the specific portfolio weights of each country within the cluster. In reality, it’s even more granular: only certain regions might have bank holidays, and only specific locations may be operating. This makes it incredibly difficult to estimate a “blanket” impact at the country or cluster level. You must layer in seasonality, store traffic, changing consumer habits, and even the weather (which dictates whether people buy chocolate eggs or ice cream).

    Operational Friction: The Warehouse vs. The Office

    There is often a disconnect between the “white-collar” plan and the “blue-collar” execution. The head office might be closed, but autonomous or highly automated warehouses might operate 24/7, even adding Saturday shifts to clear the backlog.

    It is vital to have the functionality in your system to flag specific Distribution Centers (DCs) that are making orders. We need to know exactly which nodes are generating shipments to ensure the “Golden Triangle” of Cost, Service, and Inventory remains balanced.

    The 7-Step Strategic Recommendation: Keep the Conversation Going

    Success in Easter planning isn’t a “set and forget” task; it requires a recursive S&OP (Sales & Operations Planning) cycle. Depending on your product’s shelf life and market specifics, I recommend this flow:

    1. Gather Information: Collective data from Sales, Marketing, and Supply.
    2. Conflict Detection: Identify where there are biggest conflicts issues (example – demand exceeds capacity)
    3. Conflict Resolution: Finding the “middle ground” solution.
    4. Alignment & Summary: Ensuring every department is on the same page.
    5. Implementation: Lock the strategy into the execution system.
    6. Results Review: Real-time tracking of the “Go-Live.”
    7. Post-Mortem Analysis: Capturing the “Lessons Learned” for next year.

    What Usually Goes Wrong?

    In the heat of the season, several execution traps tend to emerge. I’ve categorized these from my years in the field:

    Manufacturing & Supply Chain Hurdles

    • Late Labels: Seasonal packaging or labels delivered to the factory too late for the production window.
    • Design Delays: Packaging artwork sitting with designers while the production line waits.
    • The MOQ Trap: Minimum Order Quantities on seasonal SKUs forcing you to produce more than the market can absorb.
    • The FIFO Conflict: Because of “First-In, First-Out” rules, warehouses ship regular products first, while the seasonal “Easter-labeled” stock sits at the back until it becomes obsolete.
    • Capacity Blocks: Running a seasonal SKU often prevents the factory from producing the regular products.
    • Shelf-Life Overproduction: Sites fearing a stock-out might overproduce regular items, leading to “short-coded” stock that customers refuse to accept.

    Warehouse & Logistics Constraints

    • Resource Scarcity: Failing to estimate the exact manpower needed—leading to either a “bottleneck” where shipments can’t leave or “idle time” where staff have no work.
    • Space Limitations: Most warehouses aren’t built to store a double inventory (both regular and seasonal peaks) simultaneously.
    • Fragility Issues: Chocolate figures (bunnies, eggs) are hollow and easily crushed. Their value is entirely in their shape; if the “protection” fails, the product is worthless.
    • The Transport Limit: You might have the stock and the people, but are there enough trucks? The market for freight tightens significantly during holiday peaks.

    Co-Packing & Retail Challenges

    • Display Readiness: Seasonal SKUs meant for secondary placements (displays/shippers) aren’t ready when the co-packer needs them.
    • Transit Damage: Fragile cardboard displays often arrive at the store destroyed, leading to poor “on-shelf” execution.
    • The Customer Complaint: Retailers refusing to take seasonal labeled products too early—or too late—leaving you with a stranded stock.

    The Demand Pattern: The “Before” and the “After”

    Forecasting must analyze the pattern of orders across several years to estimate the “Easter Curve.”

    • The Lead-Up: Key Accounts must feed Marketing activations and S&OP cycles with clear data on when the peak starts.
    • The Post-Easter “Dip”: For categories like sweets and chocolate, expect a slump. People have “leftover fatigue.”
    • The Post-Easter “Peak”: For staples like dairy, fruit, and fresh ready-to-eat meals, there is often a massive “refill” peak as consumers replenish their empty fridges.

    The Human Aspect: Changing Lifestyles

    Easter planning isn’t just about the holiday; it’s about the break in routine.

    • The School Effect: Kids leave school earlier. This causes an immediate drop in demand for products in vending machines and school kiosks.
    • The Fresh Clear-Out: Distributors of fresh or dairy products will stop ordering much earlier to ensure they have zero waste during the “off” period.
    • Remote Work & Travel: Many people take the days before Easter off or work remotely. If your product relies on “commuter traffic” (like office snacks or gym drinks), you must account for this migration.

    Know Your Portfolio: The Three Types of Easter SKUs

    Finally, remember that not all products are created equal during this time:

    Seasonal SKUs (In-Outs): Pure holiday products (e.g., Lindt Gold Bunny). They must appear and then disappear instantly.

    Seasonal Labeled SKUs: The same product inside, but with a festive “Easter coat” (e.g., Baking Soda with a rabbit on the pack).

    High-Demand Staples: Standard SKUs that simply explode in volume due to tradition (e.g., Ricotta in Italy or Eggs in Poland).

    Easter is a beautiful time for celebration. But for a professional planner, the real joy comes from a “Green KPI” dashboard on Tuesday morning, knowing that through collaboration and meticulous detail, the business went smoothly while everyone else was enjoying their break.

    Wishing you all happy Easter!

  • Thinking About a Career in Demand Planning? Read This First.

    I’ve spent +5 years working across Demand Planning, Forecasting, and S&OP roles, and in February 2026 I reviewed what employers consistently expect from entry-level candidates. Below, I’ll walk you through these expectations — and help you understand if Demand Planning is the right path for you.


    What Demand Planning Actually Is

    Demand Planning sits at a unique intersection of the organization. Think of it as the bridge between the commercial side (Sales, Marketing, Finance) and the operational side (Supply Planning, Production, Logistics).

    Your role is simple in theory but challenging in practice:

    • Understand what customers will buy
    • Communicate that understanding
    • Translate it into actionable numbers

    Demand Planners don’t produce products.

    They don’t set prices.

    They don’t run campaigns.

    But they ensure the entire company is working with a single, realistic view of future demand. If you do your job well, companies avoid stockouts, reduce waste, stabilize production, and make much better decisions.

    This is why the role is so cross‑functional — and why people skills matter as much as technical ones.


    Thinking if a Job in Demand Planning is a Good Idea for You?

    When you should consider Demand Planning:

    • Enjoy working with data and finding patterns
    • Like solving problems and asking “why?”
    • Feel comfortable with ambiguity
    • Enjoy interacting with different teams
    • Prefer structured work but still want room for interpretation
    • Want a job that gives broad business exposure early in your career

    It may not be the right fit if you:

    • Dislike analytical work or numbers
    • Prefer fully predictable tasks
    • Avoid discussions or conflict
    • Have difficulty summarizing information clearly
    • Don’t want to work with Excel, data tools, or systems
    • Dislike being accountable for outcomes

    The truth is: Demand Planning attracts people who enjoy clarity and logic — but are also comfortable navigating uncertainty. If that balance appeals to you, you’ll likely thrive. I saw people who were “tech nerds” – awesome in data, terrible working with people. It wasn’t good idea for them to continue in DP. I also saw a brilliant communicator who was scared of Excel. It was awesome to talk to that person but horror to work with that person. Demand Planning is more about balance between those two extremes.


    Key Requirements for Starting a Career in Demand Planning (2026 Analysis)

    Below are the competencies employers consistently list for entry-level roles — and why they matter.


    1. Analytical Skills & Basic Statistical Understanding

    Demand Planning is fundamentally about working with data. You don’t need to be a data scientist, but you must understand:

    • Trends
    • Seasonality
    • Basic forecasting logic
    • Calculations and data analysis
    • How to form conclusions from numbers

    You’ll spend a big part of your week reconciling different data sources, challenging assumptions, and explaining numerical outcomes. The stronger your analytical thinking, the faster you’ll grow.


    2. Excel & Data Visualization

    This may feel basic, but Excel remains the backbone of most demand teams — even in global corporations with advanced tools.

    To start you need to know:

    • Pivot tables
    • VLOOKUP/XLOOKUP
    • Basic formulas
    • Conditional formatting
    • Chart creation
    • How to structure data properly

    It is nice to prove your skills with a certificate or a personal project. If you have no commercial experience build something for yourself – budgeting tool, semi-automated dashboard, shopping price tracker – that’s enough to show that you know how to organize and structure data well.

    Data visualization tools like Power BI or Tableau are a plus — not a must — but you should understand the concept of dashboards.


    3. KPIs: Understanding, Measuring, and Interpreting

    Measuring KPI values is in general easy. Interpreting them is what Demand Planners get hired for.

    Expect to work with KPIs such as:

    • Forecast accuracy
    • Bias
    • Service level
    • Inventory days
    • Obsolescence

    Your value isn’t in reporting numbers but in explaining:

    • Why the Forecast Accuracy of only one brand goes down
    • What root cause created the Out Of Stock Event
    • What action should follow increase in customer orders

    This is where logical thinking truly matters.


    4. Planning Software

    Getting hands-on experience before your first job is nearly impossible — but that’s okay. What you can actually do is:

    • Learn the names of top tools. For now I would say – SAP IBP, Kinaxis, o9, Blue Yonder
    • Understand what these systems do – what are most common views, operations, functions
    • Watch demos, read documentation, or take free micro-courses – there are plenty of on YouTube or other streaming platforms

    Knowing the ecosystem shows that you’re proactive and understand modern planning processes. Bonus points for you!


    5. Cross‑Functional Collaboration

    Demand Planners interact constantly with:

    • Sales
    • Marketing
    • Finance
    • Supply Planning
    • Customer service

    People will ask you questions, challenge your numbers, and rely on your conclusions. That means you must show:

    • Friendly, open communication
    • Ability to explain numbers clearly
    • Confidence in discussions
    • Willingness to listen and find alignment

    It’s not a “sit quietly and forecast alone” type of job — communication is half the role. You also have to be prepared for:

    working under pressure (especially when the DMR is just around the corner and slides are still not ready!),

    dealing with people’s emotions (to answer questions like What? I don’t care that leadtime is 4 weeks, I need product NOW)

    staying calm (your miss-click can trigger production worth milions of EUR)


    6. English (Especially Corporate English)

    If you plan to work in a global corporation, strong spoken English is non‑negotiable. You will have to talk in English, write and read mails and even work in software that probably will be in English.

    OK, maybe we live in area of LLMs where AI can help you write emails, but…

    • It cannot replace you during a meeting
    • It cannot negotiate alignment
    • It cannot represent your viewpoint
    • It cannot clarify misunderstandings

    Focus on:

    • Business vocabulary
    • Meeting language
    • Common terms in planning and supply chain
    • Abbreviations (SKU, S&OP, MOQ, etc.)

    The more confident you are, the easier the job becomes.


    7. Degree

    Most companies still require a degree, usually in areas like:

    • Business
    • Economics
    • Engineering
    • Mathematics
    • Supply Chain

    However, from my experience, your skills matter more than your diploma. A motivated candidate with strong Excel skills and analytical potential often stands out more than someone with a “perfect” degree but no initiative.


    Some examples of entry-level job offers:

    Final Thoughts

    Demand Planning is an excellent career entry point if you want a strong understanding of how large companies operate. You’ll work with data, processes, people, and systems — all at once. It gives you visibility, responsibility, and a wide set of transferable skills.

    But it also requires curiosity, discipline, communication skills, and a willingness to challenge the status quo.

    If those qualities resonate with you, then Demand Planning might be the career door that changes everything.

  • Forecasting Errors

    I recently found somewhere on the internet this quote:

    “Forecasting is the art of saying what will happen, and then explaining why it didn’t.”

    A forecast, by its very nature, will never be perfect. It can be statistically sound, highly disciplined, and remarkably accurate, but it will never achieve 100% certainty.

    The world is simply too volatile.

    From localized supply disruptions and material shortages to “Black Swan” events like pandemics, geopolitical shifts, or sudden regulatory changes, there is always an unpredictable variable waiting to disrupt our models. Even something as simple as an unseasonable temperature spike or a late delivery can impact a finely-tuned plan.

    Since we cannot eliminate error, our value as professionals lies in how we manage it.

    To move from reactive firefighting to proactive planning, we must follow a three-step evolution:

    1. Let go of “perfection trap” and accept that variance is an inherent part of the business.
    2. Detect and measure as crazy – We cannot manage what we do not measure. We must implement high quality KPIs to identify where and when our predictions diverged from reality.
    3. Turn Data into Root Cause Analysis – Measuring the error is only half the battle. The real “art” is understanding the why behind the delta, allowing us to prepare better for the future.

    So, if you are already over the point No. 1 (seriously, accept that your forecast will never be perfect, otherwise change your profession), let’s focus on the analytical part: detecting and measuring forecasting errors.

    Here are the most popular KPIs for measuring forecast errors in demand planning, supply chain, and business forecasting:

    • Forecast BIAS
    • MAD
    • MAPE
    • RMSE

    I’ll explain each one in simple, straightforward way to make you feel confident in this field.

    1. Forecast Bias

    The difference between the actual value and the forecasted value.

    What it tells you in easy words:
    It shows whether your forecasts are too high (over-forecasting) or too low (under-forecasting).

    Positive bias = tending to overestimate

    Negative bias = tending to underestimate

    Advantages

    • Very easy to interpret: immediately tells you the direction of the problem (are we consistently too optimistic or too pessimistic?)
    • Critical for business decisions — e.g., chronic over-forecasting creates excess inventory, chronic under-forecasting causes stockouts and lost sales

    Disadvantages

    • Positive and negative errors cancel each other out → you can have a near-zero bias even with large errors in both directions (very misleading if used alone).
    • Doesn’t tell you anything about the size or magnitude of the errors.

    2. MAD / MAE (Mean Absolute Deviation / Mean Absolute Error)

    The absolute value of the error (ignoring whether it’s positive or negative).


    It’s the average size of your errors, ignoring whether they were over- or under-. If MAD = 120 units, your forecasts are wrong by 120 units on average (in absolute terms).

    Advantages

    • No cancellation of positive/negative errors → gives a honest picture of typical error size.
    • Super intuitive and expressed in the same units as your data (e.g., pieces, kg) → easy to explain to managers and planners.
    • Treats every error equally (no extra punishment for big ones) → robust when you have occasional outliers or “crazy” values.

    Disadvantages

    • Doesn’t penalize large errors more than small ones → if big misses hurt your business much more (e.g., stockouts of high-value items), it underplays their importance.
    • Not scaled → hard to compare accuracy across products with very different volumes (50-unit error on a 100-unit item is worse than on a 10,000-unit item).

    3. MAPE (Mean Absolute Percentage Error)

    The average of absolute percentage errors across all data points.


    It shows the average error as a percentage of the actual value. If MAPE = 12%, your forecasts are off by 12% on average (in relative terms).

    Advantages

    • Scale-independent → great for comparing accuracy across products, categories, or time periods with very different volumes (e.g., comparing a slow-moving spare part to a fast-moving SKU).
    • Very intuitive for non-technical people → “we’re wrong by about 15% on average” is easy to understand and communicate.
    • Widely used and expected in business reporting.

    Disadvantages

    • Becomes extremely large or even undefined when actual values are zero or very close to zero (division by zero or tiny numbers blows up the percentage, sometimes worth to exclude such cases).
    • Asymmetric: over-forecasting a small number hurts MAPE much more than under-forecasting → can bias models toward lower forecasts when optimized on MAPE.

    4. RMSE (Root Mean Square Error)

    The square root of the MSE (Mean Squared Error), giving a measure of the average magnitude of the forecast errors.


    It’s like MAD but gives much more weight to your largest errors (because errors are squared before averaging, then square-rooted back). It still ends up in the same units as your data.

    Advantages

    • Strongly penalizes big errors → perfect when large misses are especially costly (e.g., under-forecasting peak demand)
    • Same units as the original data → reasonably interpretable.

    Disadvantages

    • Very sensitive to outliers → one or two huge errors can make RMSE look dramatically worse, even if most forecasts are good.
    • Harder to explain to non-technical stakeholders than MAD or MAPE (“what does an RMSE of 450 really mean?”).

    Below you can find quick Recommendation Table (when to prefer each)

    MetricBest when you want to…Avoid when…Business-friendliness
    BiasDetect systematic over/under-forecastingYou only care about error magnitude★★★★★
    MAD/MAERobust average error size, no outlier dramaLarge errors hurt much more than small ones★★★★☆
    MAPECompare across very different scales/volumesMany zeros or very small actuals★★★★★
    RMSEHeavily penalize big, expensive mistakesYou have outliers that aren’t meaningful★★★☆☆

    In practice, most mature forecasting teams look at several of these together — especially Bias + one absolute measure (MAD or MAPE) + RMSE when big errors matter a lot.

    Summary

    I hope this short comparison of KPIs makes it easier for you to select exactly the ones you need! Remember, the audience to whom you want to show the data is key, so select your KPIs wisely!

    Soon, I will prepare the next post for you, in which I will dive deep into Step No. 3: how to use those calculations to generate real insights. Stay tuned!